
📌 Article Overview: Build pivot tables, generate instant charts, clean messy data columns, and master keyboard navigation in Excel and Google Sheets.
Table of Contents
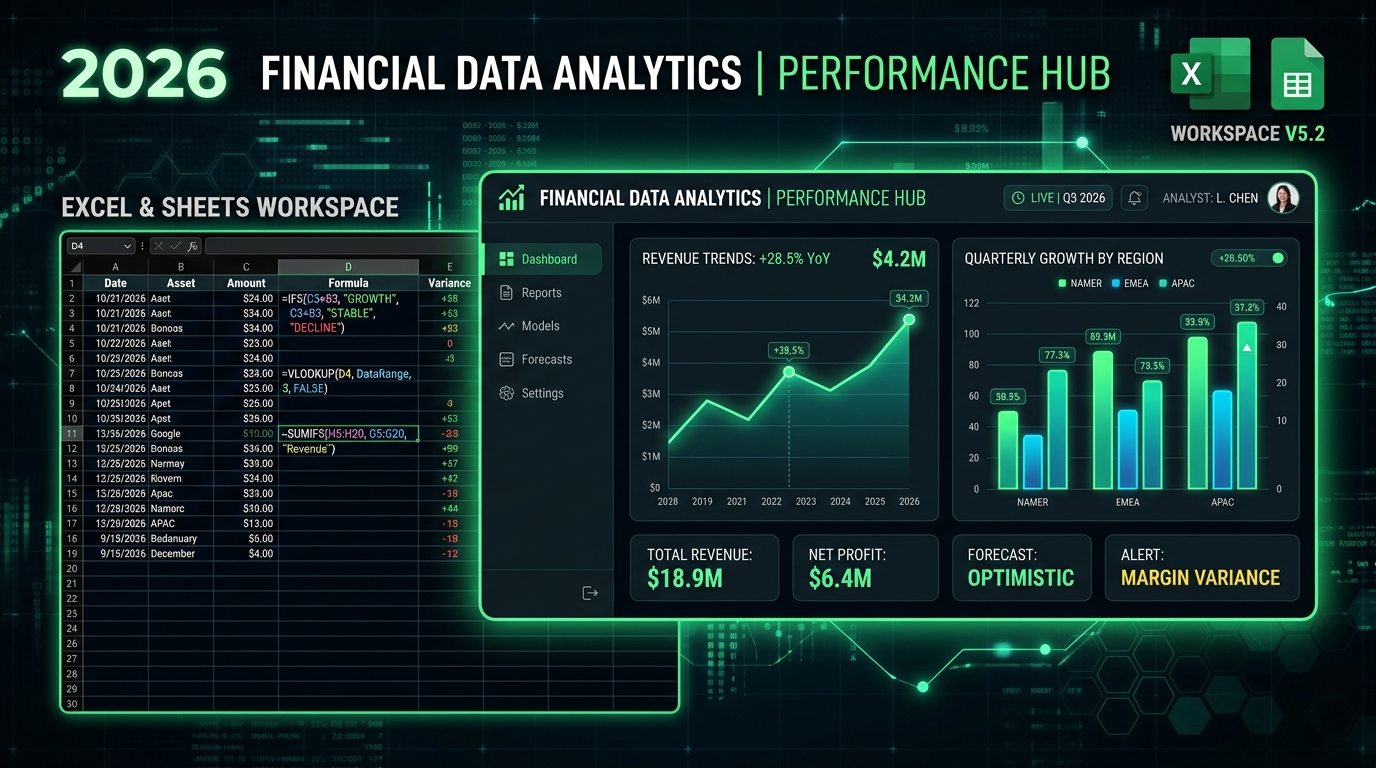
Transform raw data into business intelligence dashboards using pivot table hotkeys, automated charting commands, and text formatting hacks.
BI Dashboard Acceleration
Building automated data summary tables without mouse clicks enables financial analysts to clean, group, and visualize quarterly sales data in under two minutes.
1. Pivot Table & Chart Hotkeys
| Action / Command | Shortcut Combination | Analyst Benefit |
|---|---|---|
| Insert Embedded Chart | Alt + F1 | Create instant column chart on active worksheet. |
| Create Chart Sheet | F11 | Generate standalone chart on new tab. |
| Refresh All Connections | Ctrl + Alt + F5 | Re-query external database sources and pivot tables. |
| Toggle AutoFilter | Alt -> A -> T | Apply filter dropdown arrows across header row. |
2. Essential Data Cleaning Shortcuts
- Remove Duplicates: Press Alt -> A -> M to launch deduplication menu.
- Text to Columns Split: Press Alt -> A -> E to split comma-separated text into individual data columns.
- Flash Fill Pattern Recognition: Press Ctrl + E to automatically fill matching data patterns down a column.
Frequently Asked Questions
Q: How do I remove duplicate rows in Excel quickly?
A: Press Alt -> A -> M to launch the Remove Duplicates dialog.

Written by Challenge Hub Team
The Challenge Hub Editorial Team consists of senior tech journalists, software engineers, and productivity researchers. We specialize in operating system shortcuts, developer tool optimization, and AI workflow automation.
Discussion & Comments
0 Comments